
Observability is about understanding everything that’s happening inside your applications or systems, even when they’re complex. It involves using tools and methods to keep an eye on how things are working — like checking metrics, traces, and logs. By doing this, you can see problems before they become big issues and make your digital stuff work better.
It’s not just about watching, it’s more like having a set of practices that help you figure out what’s going on inside your system and fix things faster. This helps prevent unexpected downtime and makes your digital stuff more reliable.
Observability isn’t limited to a single role or team. It’s a practice embraced by software developers, site reliability engineers (SREs), and IT operations to enhance digital resilience. It helps in proactively identifying and resolving issues, reducing the impact and cost of unplanned downtime.
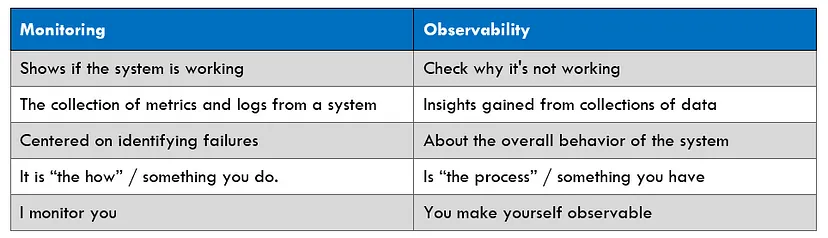
How observability differs from monitoring
Monitoring is like checking individual vital signs — it tells you if a specific part of your system is working correctly, like whether a server or service is up and running as expected. It focuses on specific predefined metrics, like CPU usage or response times, to alert you to potential issues.
Observability, on the other hand, is like having a complete health check-up. It goes beyond just checking individual parts and aims to understand how well everything is functioning together. It delves deeper into the behavior and interactions within the system, helping you understand not just what’s happening, but why it’s happening. This broader view allows you to identify and understand issues that might not be captured by traditional monitoring.
In the past, monitoring might flag a problem like a high CPU usage, but it couldn’t provide enough context or details. Observability steps in by providing a more comprehensive understanding. It can pinpoint specific pods, containers, or components contributing to the CPU spike and determine whether it’s a critical issue or not. It’s about gaining insights into the unknowns that traditional monitoring might miss.
Observability is indeed reliant on monitoring practices and metrics, but it goes further by utilizing various data sources, like traces, logs, and distributed systems’ data, to uncover insights and patterns that traditional monitoring might overlook. This approach enables teams to tackle complexities in modern systems by having a clearer, more in-depth understanding of their behavior.
How observability works
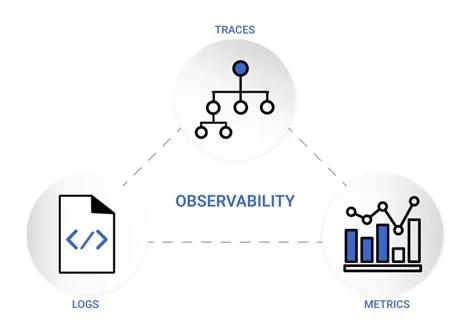
To ensure a system is observable, you need lots of data and tools to handle and analyze it. Observability relies on three types of telemetry data: metrics, logs, and traces. With this info, teams can dig deep into complex systems, finding root causes for many issues that regular monitoring might miss. When a system is fully observable, teams can:
- Monitor modern systems better.
- Track complex issues back to their source.
- See the entire architecture, breaking down to isolated parts.
Telemetry data refers to the essential information that allows a system to achieve observability. It comprises logs, metrics, and traces, often referred to as the three pillars of observability.
In this article, we will go through the top 4 observability tools, including:
- Splunk
- NewRelic
- Datadog
- Dynatrace
We aim to analyze differences or similarities between them. Is there a possibility to use an open-source observability platform? We’ll also try to answer that question by Kubernetes observability tool called Falco.
1. Splunk Observability
Splunk Observability could be a game-changer for swift issue-solving. It stands out as the sole solution offering full-stack capabilities, analytics-driven insights, and seamless integration with OpenTelemetry.
This solution includes everything needed for observability: tracking, connecting data, finding core issues, and advanced automation. Additionally, it offers unique, exclusive features:
- Real-time streaming: It operates instantly, quickly detecting and alerting about crucial patterns in seconds, no matter the data format.
- Massive scalability: Splunk Observability meets the demands of large organizations, managing massive data ingest without sacrificing performance, handling petabytes of logs daily, and millions of metrics and traces per second.
With Splunk observability solutions, we can:
- Gain complete visibility through open data ingestion and correlation of metrics, traces, and logs.
- Leverage AI-driven analytics on the entire dataset for actionable insights, enhancing user experience proactively.
- Centralize management, apply template best practices, control costs, and access observability-as-a-service for maximum ROI.
- Detect and resolve issues users face on web and mobile platforms by understanding their experiences clearly.
- Proactively identify and resolve performance issues across user activities, business transactions, and APIs.
- Simplify on-call responsibilities, reduce frustration, and enhance business outcomes with automated incident responses.
- Provide DevOps teams with actionable data for efficient diagnosis, troubleshooting, and service restoration.
Splunk Observability is a top-tier solution for monitoring and resolving issues in IT systems. It simplifies the process of tracking, troubleshooting, and solving problems across various platforms such as web, mobile, and infrastructure.
1.1. Key capabilities
Splunk actively uses and backs OpenTelemetry. OpenTelemetry was created to address the challenge of collecting data from various applications onto a single platform. It standardizes how telemetry data gets gathered and transferred to data platforms like Splunk.
OpenTelemetry is the combination of two overlapping open-source distributed tracing projects, OpenTracing and OpenCensus, merged into a single project. OpenTelemetry consists of three main components:
- Specifications: These are the open standard protocols that form the foundation of OpenTelemetry, including the implementation requirements.
- Instrumentation Libraries: The language-specific libraries for implementing OpenTelemetry. This is what you will use to instrument your applications and generate data to be sent to the OpenTelemetry Collector.
- The Collector: A single product which receives, processes, and forwards your data to the desired Observability back-end(s).
By using Splunk Observability Cloud, we can achieve full-stack observability of all data sources, including infrastructure, applications, and user interfaces. Splunk Observability Cloud platform includes the following products.
1. Splunk Infrastructure Monitoring
It supports a wide range of integrations to gather different types of data, including system metrics from infrastructure components and custom application data using OpenTelemetry collector. Additionally, it supports integration with three major cloud providers (AWS, GCP, Azure).
Amazon Web Services integration
1. Utilize Splunk Observability Cloud’s guided setup
Google Cloud Platform integration
1. Utilize Splunk Observability Cloud’s guided setup.
2. Connect using the Splunk Observability Cloud API.
Microsoft Azure integration
1. Utilize Splunk Observability Cloud’s guided setup.
2. Connect via the Splunk Observability Cloud API.
2. Splunk Application Performance Monitoring (APM)
It gathers and analyzes every span and trace from the services connected to Splunk Observability Cloud, providing comprehensive access to your application data. To transmit traces to Splunk APM, deploy the OpenTelemetry Collector on the hosts running your applications. Splunk Observability Cloud provides OpenTelemetry Collector distributions for Kubernetes, Linux, Windows, Amazon ECS Fargate and Amazon ECS EC2. These distributions streamline data collection from hosts and forward it to the Splunk Observability Cloud.
3. Splunk Real User Monitoring (RUM)
It gives you insight about the performance and health of the front-end user experience of your application. Splunk RUM offers two solutions:
- Splunk RUM for Browser: Collects performance metrics, web vitals, errors, and other forms of data for every user session to enable you to detect and troubleshoot problems in your application. For a complete view of your application from browser to back-end, integrate with Splunk APM.
- Splunk RUM for Mobile: Provides visibility into every user session of your native iOS and Android mobile applications by equipping you with comprehensive performance monitoring, directed troubleshooting, and full-stack observability.
4. Splunk Log Observer
It facilitates integration with Splunk Enterprise or Splunk Cloud Platform, allowing effective querying of application and infrastructure logs. This setup helps you understand and resolve issues in both applications and infrastructure by using detailed logs.
1.2. Alerting
Splunk Observability Cloud uses detectors, events, alerts, and notifications to keep you updated when specific conditions are met. A detector acts like a chart, monitoring signals and triggering alerts based on rules you set. For instance, it can alert you when a value crosses a certain threshold.
Rules in a detector create alerts when their conditions are fulfilled. These rules are categorized by severity levels such as Info, Warning, Minor, Major, and Critical. When data matches a condition, the detector creates a trigger event and an alert with a specific severity.
You can set alerts to notify using Splunk On-Call or third-party services such as Amazon EventBridge, BigPanda, Jira, Microsoft Teams, Opsgenie, PagerDuty, ServiceNow, Slack, Webhook, xMatters.
1.3. Pricing
Splunk Observability Cloud starts at $15 per host per month when billed annually. The pricing is determined by the number of hosts or devices monitored within the Splunk Observability Cloud platform. For full end-to-end observability with all features enabled, the cost increases to $75 per host. Additionally, to accommodate Splunk log observation, you’ll need Splunk Enterprise or Splunk Cloud Platform, the pricing of which varies based on the volume of data ingested daily. Specifics about the costs of these two products are not publicly disclosed by Splunk, as they are considered part of the company’s agreements. However, you can find an overview of the pricing structure for Splunk Cloud Platform product on the AWS Marketplace.
1.4. AI/ML
Splunk provides several ways of utilizing AI/ML across the product portfolio. Broadly, there are two ways of using AI/ML: using out-of-the-box features that are deeply integrated into existing product workflows, or through customization.
ML is integrated into the Splunk platform within Splunk Cloud Platform and Splunk Enterprise, allowing users to:
- Detect anomalies, such as identifying outliers in the number of application errors.
- Generate forecasts, for example forecasting resource utilization.
- Make predictions, like predicting potential outages.
- Cluster data into groups, for instance, clustering network activity to detect potentially misconfigured services.
By applying artificial intelligence and machine learning across all ITOps functions, Splunk provides flexible and scalable solutions that adapt to organizational growth. It enables the prediction of outages before they impact customers, utilizes predictive cause analysis to identify root issues across services, apps, and infrastructure, and forecasts service degradation up to 30–40 minutes in advance through adaptive thresholds and anomaly detection. With 360° visibility, Splunk offers complete insight into the health of applications, systems, and infrastructure, while centralizing diverse data types and performance metrics into a single, accessible location for streamlined analysis and decision-making.
2. New Relic
New Relic is a cutting-edge platform designed to empower businesses with in-depth insights into their applications and infrastructure. Whether your application is written in Java, Python, .NET, Ruby, or another language, New Relic provides a specialized agent-based monitoring, offering a seamless and comprehensive solution for organizations to optimize performance, troubleshoot issues, and enhance overall reliability. New Relic provides end-to-end visibility into your applications and infrastructure. From user interactions and code execution to underlying infrastructure components, this tool enables a holistic understanding of your entire technology stack.
Basic setup
The foundation of New Relic’s observability lies in its lightweight agents that are installed across your applications and infrastructure. These agents collect real-time data on various metrics and events. Once gathered, this invaluable information is then shipped to the New Relic platform for analysis, providing a holistic view of your entire ecosystem.
Other integrations
- OpenTelemetry
- Grafana
- VMware Tanzu
- Apache Airflow
- And more
2.1. Key capabilities
Data monitoring encompasses a comprehensive suite of tools designed to enhance the operational efficiency and performance of various technological environments. APM allows monitoring the performance of applications in real-time which leads to bottlenecks identification, slow transactions’ discovery, hence code optimizations, so an exceptional user experience can be delivered. Browser monitoring provides a real user monitoring (RUM) solution. It measures speed and performance as end users navigate to a website through different web browsers, devices, operating systems, and networks.
Infrastructure monitoring provides complete observability of complex and hybrid systems, from a datacenter to numerous cloud providers and instances. Kubernetes monitoring provides observability into layers of Kubernetes complexity to gain clear insight of cluster performance, from the heights of the control plane down to applications running on a single pod. Log management is a fast and scalable platform for connecting logs with the rest of the telemetry and infrastructure data in a single place. It provides more in-depth visibility into application and infrastructure performance data (events, errors, traces, and more) to reduce mean time to resolution (MTTR) and higher efficiency in troubleshooting of production incidents. Mobile monitoring provides more in-depth visibility into the performance and crash troubleshooting of your Android, iOS, or hybrid mobile applications. Model performance monitoring provides visibility into the performance of machine-learning applications by monitoring the behavior and effectiveness of models. Network monitoring provides monitoring of the following types of network data: device performance via SNMP, network syslogs, cloud flow logs, network flow logs. Serverless function monitoring — monitoring serverless functions from AWS, Azure, or Google Cloud. Synthetic monitoring provides monitoring of availability and performance of a single page, including a full-page load.
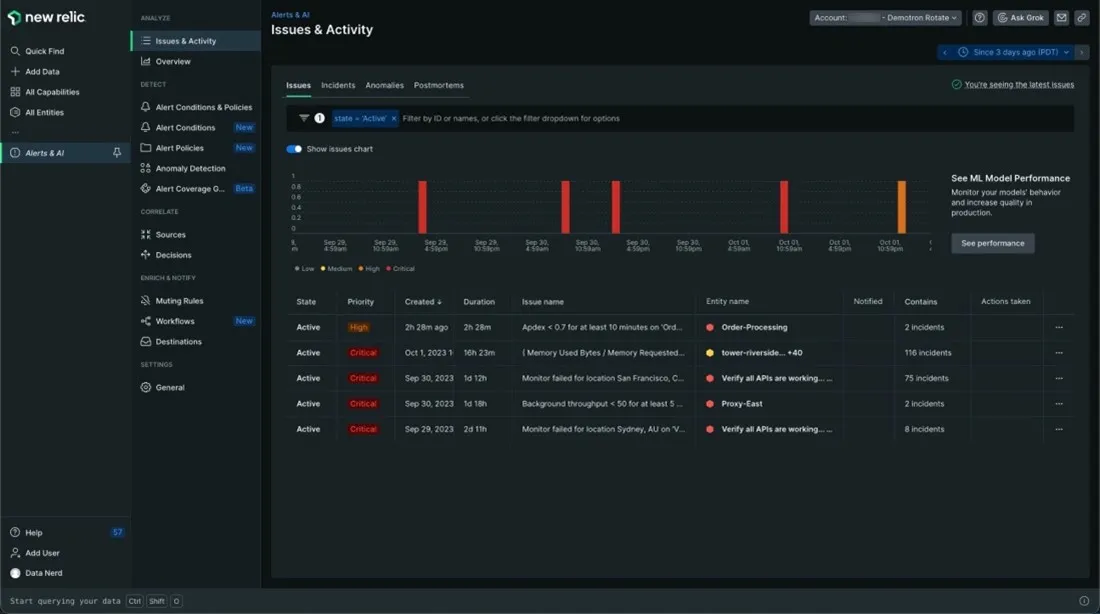
Data insights tools go a step further than basic monitoring by employing sophisticated algorithms and methodologies to enhance system reliability and performance. These tools, such as alerts and applied intelligence offer a flexible system that allows getting informed about issues for any entity or stream of telemetry data. Applied intelligence is an engine that notifies about potential problems by identifying anomalous behavior, correlating any relevant issues, and assisting with root cause analysis.
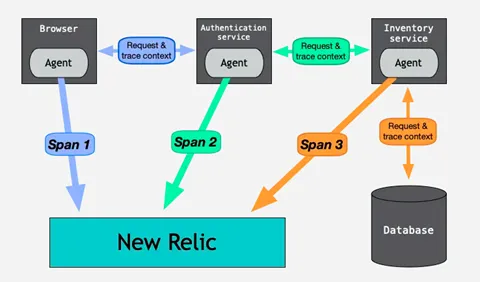
Change tracking allows capturing changes, such as deployments, on any part of the system and using them to contextualize performance data. Recording changes via API or configuring deployment pipelines to automate and view those changes as markers on charts for APM, browser, mobile, service level management, custom dashboards. Charts, dashboards and querying as well as distributed tracing. Distributed tracing collects data as requests travel from one service to another, recording each segment as a span. These spans contain important details about each segment of the request and are eventually combined into one trace. The completed trace gives a full picture of the entire request.
Service level management — service level indicators (SLIs) and service-level objectives (SLOs) can be defined and consumed for applications.
Other capabilities of New Relic include CodeStream an IDE extension that allows to shift left by making code performance part of the earliest stages of the development process. Errors inbox an error tracking solution designed to provide the tools to proactively detect, triage, and resolve errors across the full application. IAST — interactive application security testing. Vulnerability management is another useful capability that allows for just in time mitigation.
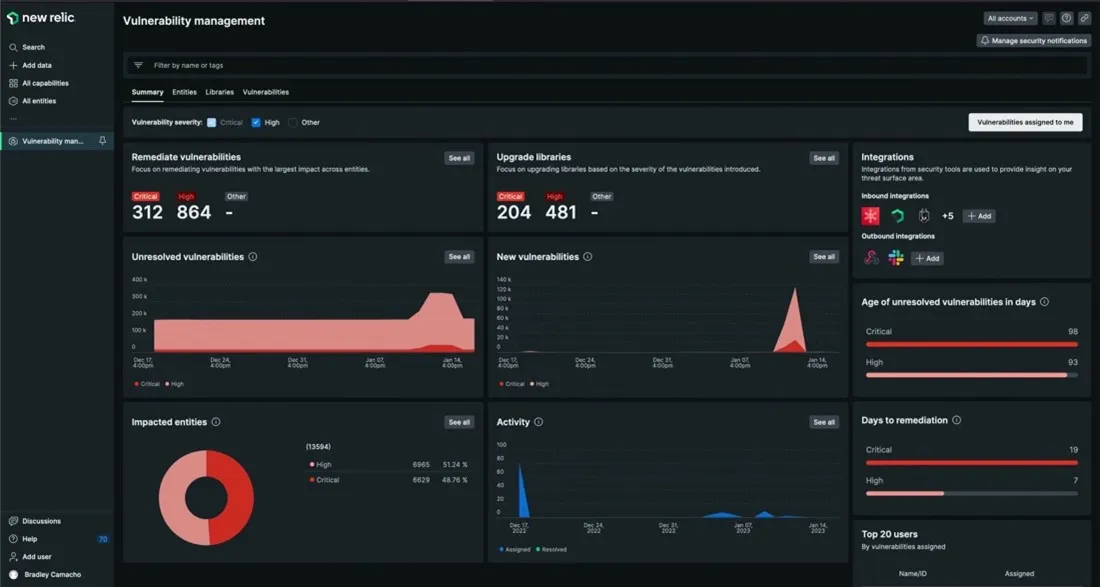
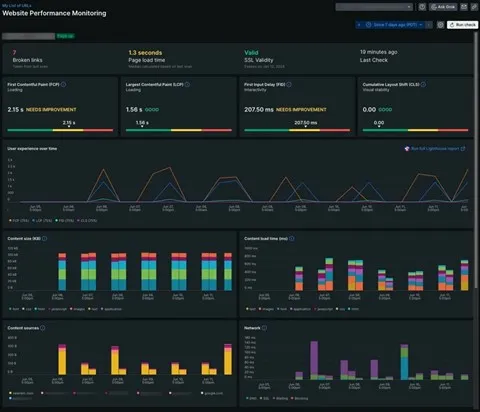
WPM (website performance monitoring) — provides insight into website’s availability and performance.
2.2. Pricing
New Relic’s pricing plan is based on the amount of data ingested and number of users, divided into 4 different plans. Free, Standard, Pro and Enterprise plans as shown in the image below. The prices shown below are actual on the date of publishing this article, however you can always visit New Relic for current prices.
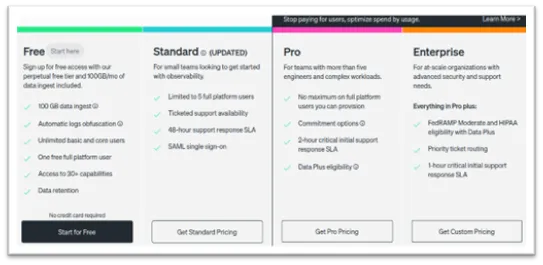
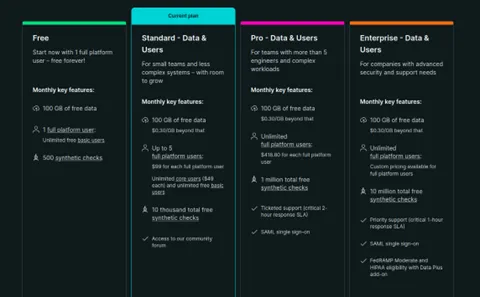
- The Standard plan offers up to 5 full users $99/user, core user (unlimited) $45/user, and 100GB of ingested data is free and $0.30/GB beyond that.
- The Pro plan offers an unlimited number of full users at $418.80/user, and the same 100GB of ingested data for free, and beyond that, $0.30/GB.
- The Enterprise plan offers full flexibility, and it is negotiated and tailored against client’s specific needs.
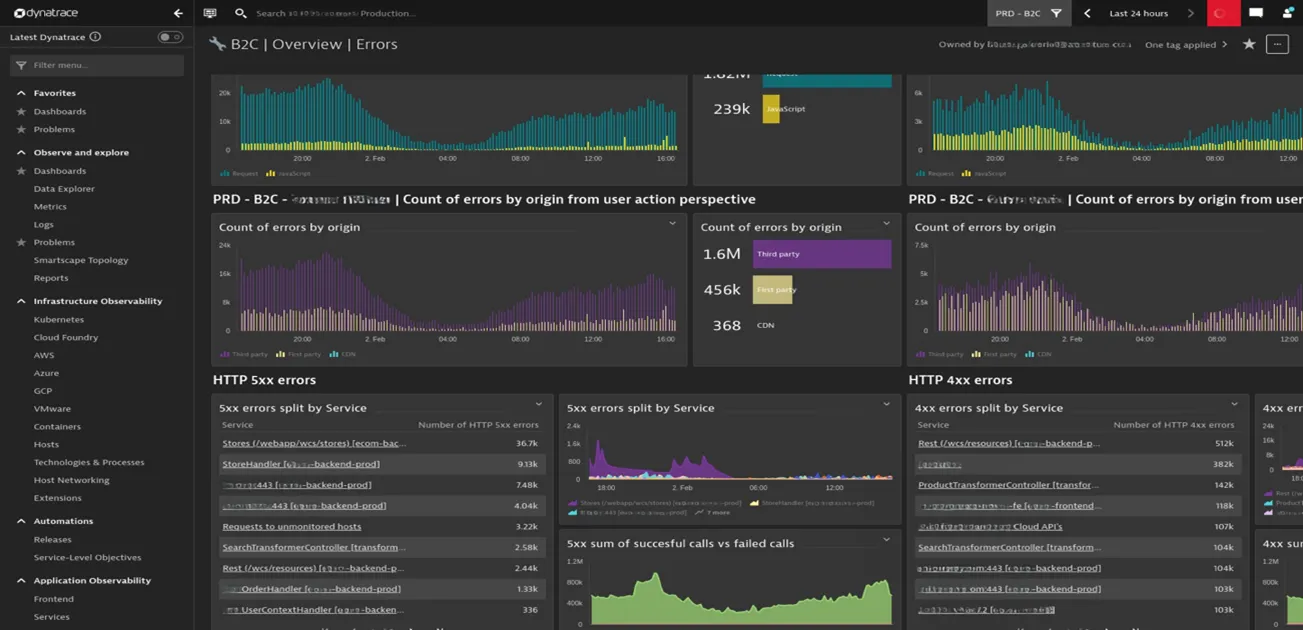
3. Dynatrace
Dynatrace in its starting days was intended for collecting and handling metrics and events data and providing automated alerting, and today has become the complete “enterprise grade” solution for monitoring and observability.
Dynatrace features infrastructure and application observability, application security, digital experience, business analytics, automations of processes, and more.
According to Gartner report, Dynatrace is a Leader in the 2023 Gartner® Magic Quadrant™ and ranked #1 in the Critical Capabilities for APM and Observability reports.
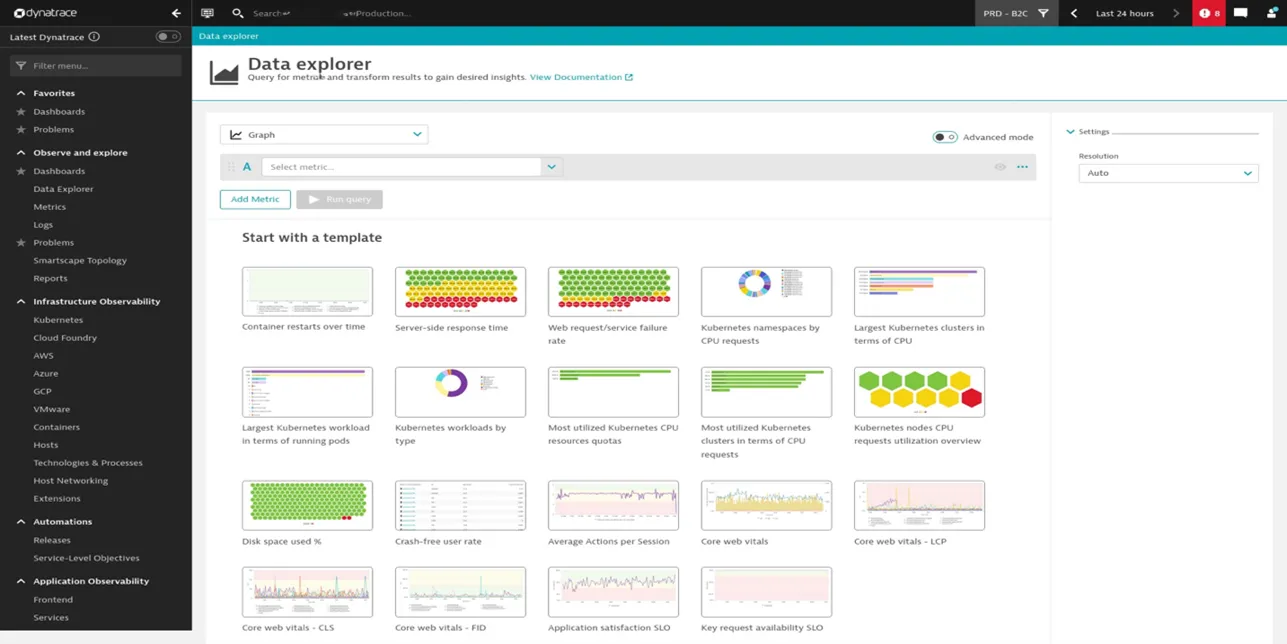
3.1. Key capabilities
Dynatrace monitoring and observability is done through implementation of multiple “collect” points. Data is collected at various parts of client’s systems, from front-end applications, networking, APIs, queues, Kafka, databases, AWS and other sources implementing Dynatrace “agents” or “open telemetry” where applicable. Note that not all frameworks and their way of implementation support “agents”, but there is a sufficient number of them to choose out. Dynatrace is applicable for both “on premise” (datacenter) and “cloud” solutions. Dynatrace can be used at various cloud providers like AWS, GCP, Azure, and with almost any “environment configuration” VMWare, Cloud Foundry, Kubernetes, Containers or even at “bare metal”.
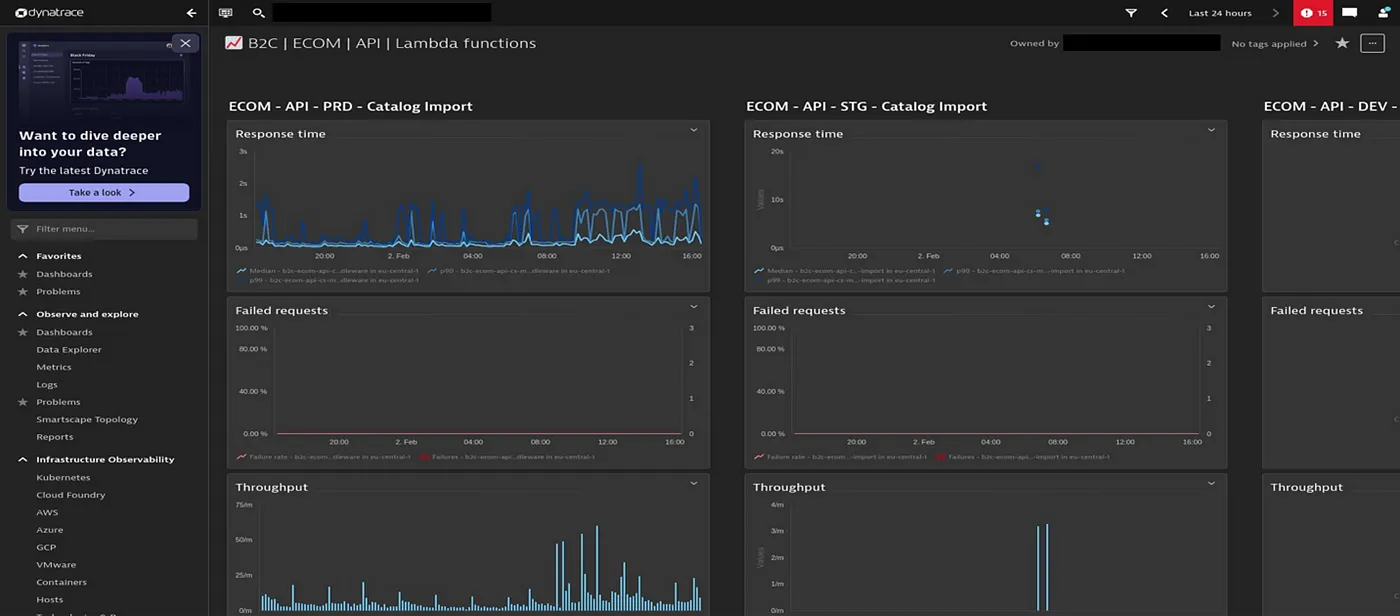
3.2. Use case
To be able to keep any of our clients’ systems running and, if needed, also to upgrade them, the first prerequisite is to be able to monitor and predict its behavior in various working conditions.
We needed to trace metrics and “operating times” of the complete path of client request to the moment response was provided, pinpoint bottlenecks, and improve slow, insufficient, and complicated parts of that process. Also, there was need to predict systems behavior under additional load during “selling seasons”, “special offer” weekends, “Black Friday”, and other “out of usual” occasions, and if feasible provide proactive improvement of systems to be capable to operate and “scale”, under heavier load.
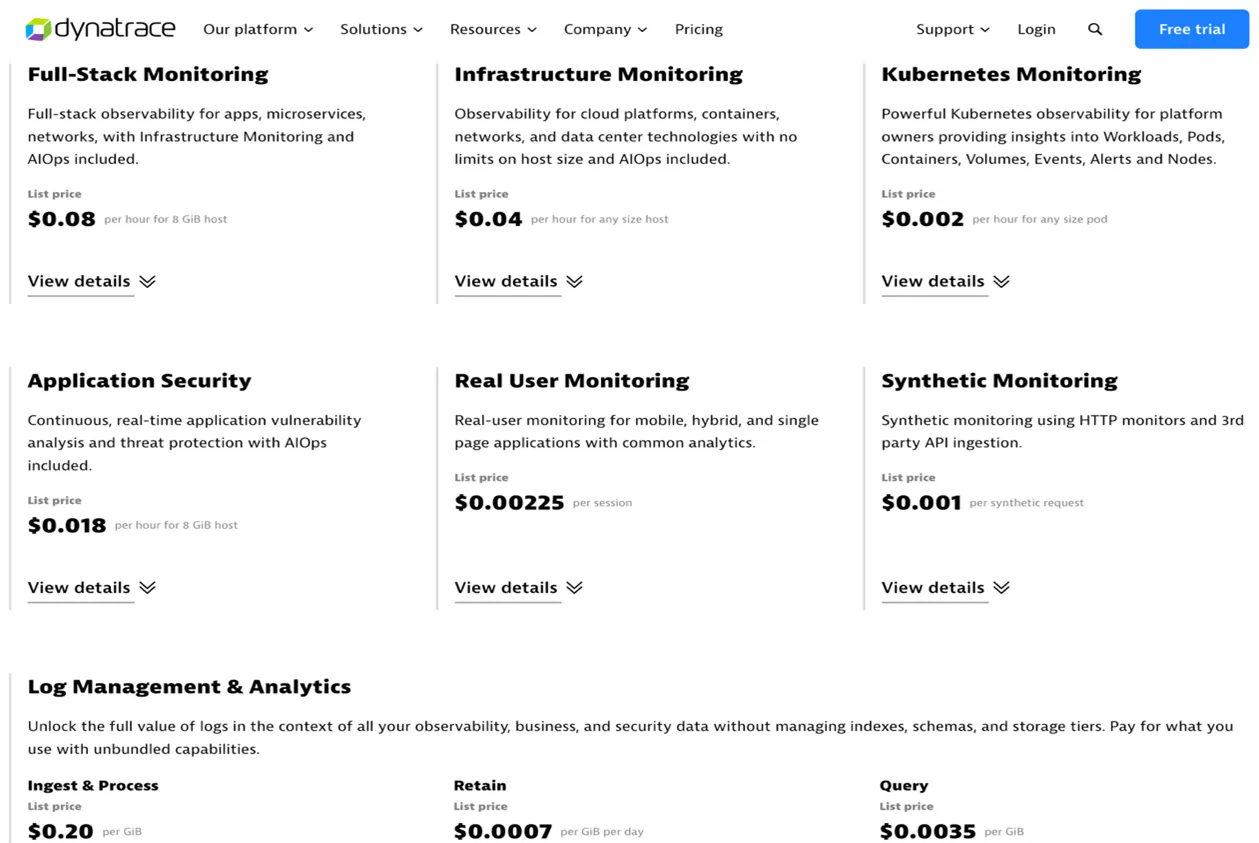
3.3. Pricing
Dynatrace is an enterprise grade tool that has “out of box” solutions for most of the use cases, it is not too complicated to implement and start with, especially with the expert support from Dynatrace. Supports AI incorporated in its Davis AI module that can assist in issues mitigation and prediction of application traffic and service loads. Dynatrace has multiple options for collection of logs and metrics from various systems. On the other hand, as with every enterprise grade solution, it can easily become expensive if you try to cover “complete” system and miss the right amount of tune-up, in cases where “how much” you want to “observe” is not set properly.
There is no easy way to set up how much data you want to log, how many distributed traces need to be captured, the number of events to capture and store, and at what intervals, and for how long to keep that information. The process to find that “reasonable” amount of data you need to have sufficient and satisfying control, and predictability of systems behavior is iterative and always open to be refined and reevaluated. Dynatrace has options and features that allow you to fine tune and offers granular set up of all your monitoring and observability needs. Also, at the same time, it can provide you with monitoring that is not focused just on individual components through collected metrics, events and logs, but with observability that reveals relationships across all systems components with AI assisted predictability of future system behavior.
4. Datadog
Datadog may be younger than some, but they kept improving the product at a steady pace, so it offers a very mature user experience, and a ton of integrations for you to pick from. In fact, despite being feature-packed and a powerful tool overall, we’d say its main advantage is how quickly you can start using it to visualize data, get insights into issues you are investigating and learn more advanced stuff as you move on.
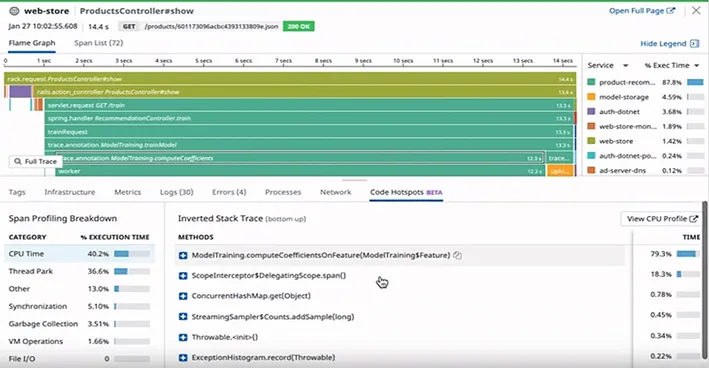
Its observability features are centered around the concept of APM (Application Performance Monitoring). The concept is not unique to Datadog, it extends the notion of observability with an idea that we do not only need end-to-end visibility into failures as they occur, but we also need a granular view of how the system performs under normal conditions, so we can anticipate failures and potential bottlenecks. If the main task of observability is to present how user requests propagate through our system, and answer where something failed and why, APM goes one step further by enriching each stage with key performance metrics and hints about our code hotspots. Datadog makes this possible with code profiling, which can be enabled without any changes to our application (though only for some programming languages).
4.1. Key capabilities
There are several ways to instrument your services and get your data in Datadog — the most immediate way is by installing Datadog Agent. In Kubernetes clusters, it can be deployed as a Deamonset via Helm chart, and it offers single-step configuration for both sending traces and profiling. The agent is not always local, for instance, if you use something like AWS RDS, it is deployed on a separate host along your database. It can also collect OpenTelemetry data, and you can also make your setup fully vendor-neutral by using Otel Collector with Datadog Exporter instead (you do lose profiling capability this way). One reason you might want to use Datadog Agent is that it offers a simple way to generate custom metrics from any source. In most cases, it will spare you from having to write your own custom agents or metric exporters.
Datadog also promises a highly correlated view of data coming from different sources, so for instance, if you use their client-side SDK for RUM (real user monitoring), you can propagate trace context from the frontend of the application (both web and mobile) to your logs and profiles. This allows you to link actual user sessions to specific events on the backend.
Once you start sending your traces in, Datadog will figure out relationships between your services and build a Service Map based on that — a graph where each service is a node connected to its upstream and downstream dependencies. In general, a service can be anything that emits some metrics to Datadog, proven they meet some conventions (like having a service tag), and each service may consist of multiple resources: i.e. an API service may have multiple endpoints, while a database service may be broken down into multiple recurring queries.
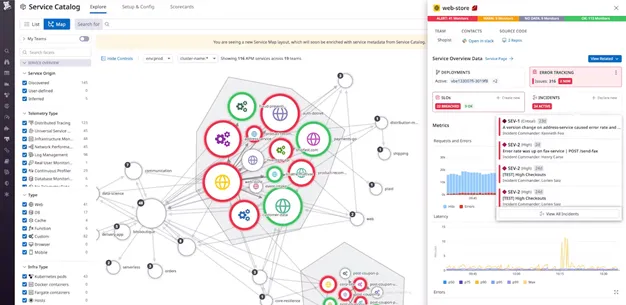
Each node will visually indicate issues and reveal key performance metrics on hover, while clicking on a particular service will bring up a focused view of its dependencies and more detailed overview of metrics, traces, and other available data. One cool feature is first-class support for deployment tracking, which means you can filter and sort your service metrics based on a version tag, so you can detect issues that cropped up during your releases.
Service Catalog builds on top of Service Map with the ability to associate certain attributes with each service: things like SLI/SLOs, responsible teams or incident playbooks, which all greatly help with establishing SRE practices in your organization.
In a highly distributed landscape, Service Map may be the preferred way of navigating around, but you can also easily build custom dashboards with a more condensed view of data that is meaningful to you. Datadog will maintain an equally rich user experience, and your custom widgets will have contextual menus where applicable, i.e. a visualization of a custom metric derived from logs will allow you to drill down to its corresponding logs, or view a list of hosts that emit a particular metric.
4.2. Alerting
Alerting in Datadog relies on “monitors”, and this is one area where it really offers an abundance of options. It can learn your traffic trends and report on things that appear as anomalies in your metric values, report on outliers in a group of hosts, or even provide forecasts about performance of your workloads. These features are based on intuitive algorithms which can be customized to accommodate specific use cases, and you can also get help from Watchdog, an AI engine that will continuously analyze your data and report on what it deems relevant. From our experience, the amount of information it outputs is rarely over the top, and often you will really get useful insights about issues you would otherwise not know about. We recommend checking the full list of supported monitor types.
Other noteworthy features include:
- Workflow automation, which can be used to mitigate incidents or close security gaps
- RBAC support, which can help larger organizations define boundaries for data access based on specific tags
- Log ingestion pipelines that facilitate custom parsing or obfuscation of sensitive data. (Note that JSON logs are parsed and indexed automatically).
- Ability to archive logs to object storage, then rehydrate logs from archives to investigate a past incident.
- Comprehensive synthetic monitors, which can range from simple health checks to multistep API tests with data passed around.
- Stellar integration with AWS, which enables deploying a single CloudFormation template to make all your CloudWatch metrics and logs available to Datadog.
4.3. Pricing
With all things said, we have nothing but praise for Datadog, so the only thing that can spoil the party is pricing, which can be on the steep side. You may get stumped by the sheer number of billable items presented on their pricing page (which is why they are also packaged into several more intuitive plans), but if you focus on billing units alone — what you pay for most of the time is the number of hosts you are monitoring. For Serverless environments, there is an alternative model based on the number of invocations and an average number of active functions.
Sadly, many vendors in this space still don’t give up on the idea of plans based on the number of hosts monitored, which makes less and less sense in cloud native environments — especially ones that scale in and out frequently. With Datadog, the number of hosts in a month is calculated based on a high watermark, excluding the top 1% of usage spikes. Assuming that you don’t have a very spiky workload, or the spikes last longer than those 1%, you are effectively paying for the maximum number of hosts that ran during a month. You should also note that containers do count as hosts in case they are deployed with an Agent as a sidecar, so be wary of the antipatterns and use a single agent instance where possible.
One common source of excessive Datadog costs are custom metrics. Note that a custom metric is not only defined by name, but also by dimensionality, meaning that the cost of a single metric is multiplied by a number of all combinations of tags that metric was ingested with. For someone coming from a Prometheus background, we find “time series” to be a more suitable term for custom metrics (since that’s what they really are). With that in mind, one should avoid granularity where it’s not really needed. To help with that, Datadog has a feature called Metrics Without Limits — it decouples metric ingestion from indexing, meaning you can export metrics with as many tags, but then provide a shortlist of queryable tags, and let Datadog aggregate the data across remaining dimensions. While this is surely useful, it’s still something you need to take care of, so we would like to see some kind of recommendation system based on historical Datadog usage and common querying patterns.
5. Falco
Falco is an open-source cloud-native runtime security project for Kubernetes environments, rooted in the principles of enhancing security and observability, it leverages Helm for effortless deployment within Kubernetes clusters while utilizing Fluent Bit for seamless data collection.
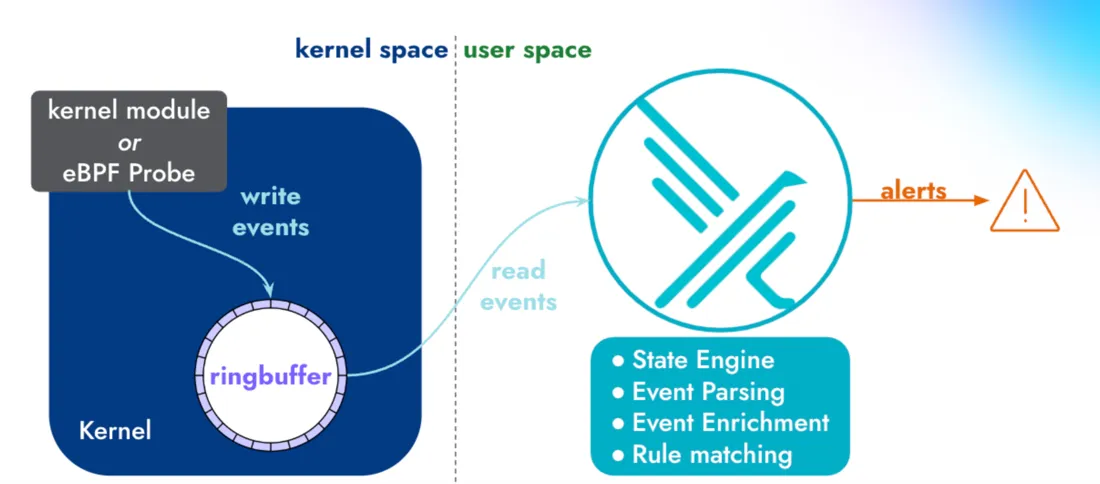
Deploying Falco is a streamlined process facilitated by Helm, the Kubernetes package manager. Helm charts simplify the installation and configuration of Falco, enabling users to effortlessly integrate it into their Kubernetes infrastructure. Once deployed, Falco becomes a vigilant guardian, monitoring the runtime behavior of applications and containers within the cluster.
To enhance its observability capabilities, Falco leverages Fluent Bit for data collection. Fluent Bit efficiently collects, parses, and forwards log data generated by containers, creating a comprehensive and real-time view of the system’s behavior.
5.1. Key capabilities
Falco, the cloud-native runtime security project, delivers a powerful set of capabilities designed to enhance the security posture of modern applications and infrastructure:
- Real-time threat detection: Falco excels in real-time threat detection, leveraging Kubernetes deep integration to detect and alert abnormal behaviors within the runtime environment. By analyzing system calls, Falco identifies potential security threats, providing a proactive defense against malicious activities.
- Container runtime monitoring: Offering unparalleled visibility into containerized environments, Falco monitors the runtime activities of containers, ensuring that any deviations from expected behavior are promptly identified. This capability is crucial for maintaining the integrity of containerized applications and safeguarding against security vulnerabilities.
- Rule-based policies: Falco operates on a rule-based engine that allows users to define and customize security policies based on their specific requirements. This flexibility empowers organizations to tailor Falco’s monitoring capabilities to align with their unique security and compliance needs.
- Rich contextual logging: Falco goes beyond traditional log monitoring by providing rich contextual logging. Each alert generated by Falco includes detailed information about the event, offering valuable insights into the nature of the potential security threat. This contextual information is invaluable for incident response and forensic analysis.
- Kubernetes audit events integration: Falco seamlessly integrates with Kubernetes audit events, enabling organizations to leverage audit logs for a more comprehensive understanding of activities within the cluster. This integration enhances observability and ensures that security teams have access to a holistic view of the Kubernetes environment.
- React to threats: With Falco and Falcosidekick, which is an event forwarder, any suspicious or potentially malicious events can be forwarded to any serverless system (AWS Lambda, GCP Cloud Functions, GCP Cloud Run, Azure Functions, and so on) to trigger actions and remediate threats.
- Improved security posture: Falco’s real-time threat detection and rule-based policies enhance the overall security posture of Kubernetes environments, helping organizations identify and mitigate potential security risks before they escalate.
- Operational visibility: By providing in-depth insights into container runtime activities, Falco enhances operational visibility. System administrators and security teams can gain a clear understanding of application behavior, facilitating more informed decision-making.
- Customizable security policies: The ability to define and customize security policies empowers organizations to tailor Falco to their specific security requirements. This adaptability ensures that the tool is an asset in diverse and dynamic Kubernetes environments.
- Streamlined incident response: With rich contextual logging and real-time alerting, Falco facilitates swift incident response. Security teams can quickly investigate and respond to potential security incidents, minimizing the impact of security breaches.
- Open-source freedom and cost-efficiency: Falco distinguishes itself as an open-source project, embodying the principles of transparency, collaboration, and community-driven development. Being open-source means that organizations can leverage Falco’s robust observability and security features without incurring subscription costs. This commitment to open source empowers businesses of all sizes to implement a powerful observability solution without the financial constraints associated with proprietary alternatives. Organizations can confidently embrace Falco as a cost-effective solution without sacrificing the quality and depth of observability required for safeguarding their Kubernetes environments.
In conclusion, Falco’s integration with Kubernetes, coupled with its robust capabilities, positions it as a vital tool for organizations seeking to enhance observability and security in their containerized environments. As the landscape of cloud-native applications continues to evolve, Falco provides the visibility and protection needed to navigate the complexities of modern infrastructure securely.
Why do we all need observability?
Finally, is observability suitable for all? Crucial consideration revolves around aligning your organization’s size with the allocated budget. In essence, key focal points are ensuring the right fit for your organization’s size, establishing a well-defined observability budget, and assessing the measurable return of investment.
Enterprise tools like Splunk, Dynatrace, New Relic and Datadog are the solutions that are offering all in one, so there is one tool for full observability, even though some of them might require special licenses and other products from the same company so that you could use all its potentials. Full integration with major public providers is also provided for all of them, so there is possibility of log collection, metrics collection as well as anomaly detection for any of the cloud providers. License pricing is different, and, in some cases, it depends on the number of users actively using the product, while in other cases, data usage is what’s important.
Compared to the enterprise tools we’ve just mentioned, open-source tools like Falco can also provide some kind of observability. Keep in mind that this kind of tool is usually providing observability for specific systems, like Kubernetes observability in the case of Falco. So, they aren’t full observability tools with full integrations with cloud, instead they could be nice solution when there is not much differentiation in the platform.
To conclude, observability is great, it can provide so many details of the systems where it’s fully set up. Furthermore, it’s also helping improvements of the systems with detailed metrics and logs collections, as well as anomaly detection. However, it can be expensive, so be careful when setting it up, maybe you’ll be broke! 🙂
In this article:
Darko Opalić,
Ivan Ćurčin,
Dušan Bokan,
Lazar Veljović
Levi9 Serbia