Lambda functions running in Node.js are really powerful tool for building scalable and cost-effective serverless applications. However, when a bug pops up during the development process or in production (and it always does!), debugging can be challenging, especially in a serverless environment.
The small team who wrote this blog comes from a Java background, where we took debugging for granted, especially when debugging synchronous code.
Therefore, one could be disappointed in the developer’s experience when trying to fix a bug in even a simple Lambda written in Node.js.
In this blog post, we’ll bring to light various techniques and tools to (semi)effectively debug Node.js Lambda functions.
Technique #1 — Debugging Lambda locally using a plain old unit test
The first, and (maybe) the simplest setup is to use a plain old unit test to run your Lambda locally.
The unit test is here used just as a harness to ignite the Lambda handler.
The code would be executed using your local Node.js runtime while it would connect to the rest of the infrastructure on AWS, for example, DynamoDB, S3, etc. This has certain downsides since you will not be able to consume resources that reside in a VPC on AWS, for example, a Redis cluster. But this particular drawback mentioned can be solved by spawning a cluster in localhost using Docker.
Since the Lambda function requires the same set of environment variables as it would when it ran in the Cloud, you will have to provide them on your own. One shortcut you can take here is to copy them from the AWS Lambda console GUI.
An example code on how to run the unit test follows. The handler is just an implementation of a LambdaInterface from AWS Powertools.
					process.env.AWS_REGION = 'eu-west-1';
process.env.AWS_EXECUTION_ENV = '';
process.env.AWS_NODEJS_CONNECTION_REUSE_ENABLED='1';

import {APIGatewayProxyEvent, APIGatewayProxyEventHeaders, Context} from 'aws-lambda';
import {handler} from './lambda-booking-creation';

const MOCK_OK_EVENT_BODY = {
    bookingDetail: {
        source: 'DE',
    },
    transaction: {
        uuid: 111222333,
    },
};

describe(Booking creation lambda test', () => {
    test('Test happy flow, returns 201', async () => {
        const response = await handler.call({},
            createMockEvent(JSON.stringify(MOCK_OK_EVENT_BODY), { Authorization: 'Basic test'} ),
            {} as Context);
        expect(response.statusCode).toBe(201);
    });
});


function createMockEvent(body: string, headers: any) {
    return { body: body, headers: headers as APIGatewayProxyEventHeaders } as APIGatewayProxyEvent;
}
Pros
- It’s simple to set up due to no additional tools, but the basic unit test setup needed, for example, Jest.
- No time to wait for a deployment since, after fixing the code locally, you can just quickly rerun the test.
Cons
- Cannot access resources in VPC (please see the section below).
- The list of environment variables needs to be maintained.
Technique #2 — Debugging Lambda deployed using AWS SAM CLI
AWS SAM is an open-source framework used for building applications on AWS. It is built on top of AWS CloudFormation and provides shortened syntax to describe applications using simple YAML template. AWS SAM transforms that template into AWS CloudFormation template during deployment.
AWS SAM CLI, or SAM Local, is a command line interface that enables local development, testing and debugging. SAM CLI creates a local container and builds your function. When it is done, you can just invoke your function and check the response.
Pros
- Easily generate event payload.
- Local invocation, testing, and debugging locally.
Cons
- Not possible to connect to the rest of AWS infrastructure.
- Need to prepare inputs and invoke functions from your local.
Technique #3 — Debugging Lambda deployed using Merloc
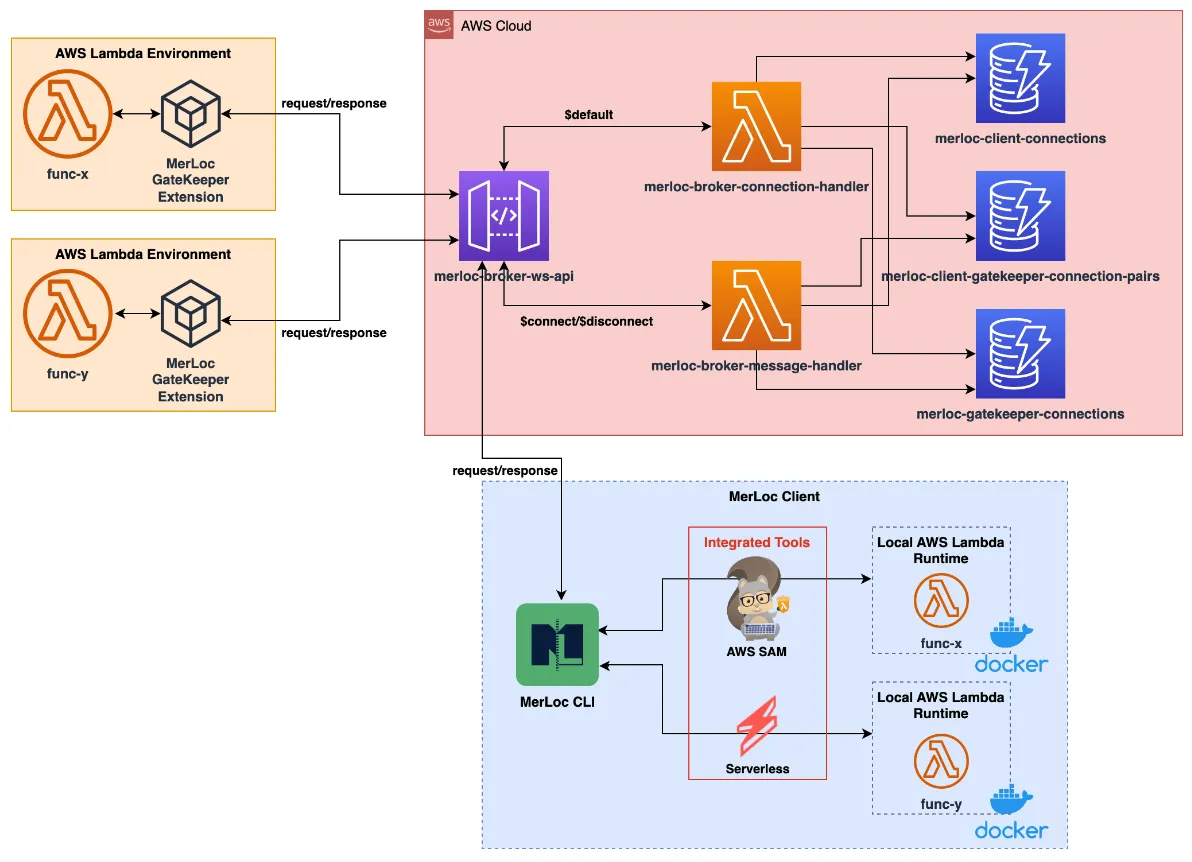
Merloc is a debugging tool that allows you to run and debug lambda on your local while it is still part of the AWS cloud remote. It supports Java, Go, Python, Node.js & .NET runtimes. If you are using SAM or Serverless Framework as a tool for building your applications, Merloc is the right choice for you. On the other hand, if you prefer AWS CDK more, Merloc is not working perfectly since it is not meant for that. There are possible adjustments, but it requires some time to set things up. That will be explained below.
Installation and running
1. Clone the project from https://github.com/thundra-io/merloc.
2. Deploy merloc infrastructure.
- Go to broker stack deployment folder cd merloc-broker/stack/deployment
- Start deploy by running PROFILE=dev ./deploy.sh
3. Get and save output from deployment:
merloc-broker-stack-dev.merlocbrokerurloutputdev = wss://szmglosakb.execute-api.eu-central-1.amazonaws.com/dev
4. Add GateKeeper layer to your lambda function in the following format:
arn:aws:lambda:${region}:${account}:layer:merloc-gatekeeper-nodejs:${version}
Check here if there is some change and what is the lastest available version.
5. Add environment variables:
					Resources:
  HelloWorldFunction:
    Type: AWS::Serverless::Function
    Properties:
      CodeUri: hello-world/

      FunctionName: sam-test-function
      Handler: app.lambdaHandler
      Runtime: nodejs16.x
      Layers:
        - arn:aws:lambda:eu-central-1:${account}:layer:merloc-gatekeeper-nodejs:4
      Environment:
        Variables:
          AWS_LAMBDA_EXEC_WRAPPER: "/opt/extensions/merloc-gatekeeper-ext/bootstrap"
          MERLOC_BROKER_URL: "wss://snwyp2btq0.execute-api.eu-central-1.amazonaws.com/dev"
          MERLOC_SAM_FUNCTION_NAME: "HelloWorldFunction"
6. Install merloc cli. Install the latest version of merloc using the following command:
npm install merloc-cli
7. Run merloc:
merloc -b <YOUR_BROKER_URL> -i sam-local –r
- -b is broker url that you saved in step 4
- -i is default invoker (sam-local or serverless-local)
- -r enables hot-reloading
You should see the message Initialization completed. MerLoc is ready!
8. Invoke lambda function
You should see the message <function-name> Debugger listening on ws://0.0.0.0:<debug-port-no>/<debug-session-id>
9. Add breakpoints
Add breakpoints and attach your debugger to <debug-port-no> on localhost.
Message <function-name> Debugger attached is presented.
10. If you change the code, invoke your lambda function again and you should see the execution with your changes.
Note for debugging
When you run Merloc in debug mode you will be able to debug transpiled code (javascript) that is not always a good solution. If you want to debug your source code (typescript), source maps can help with that. Source maps is a file that maps transpiled code back to the original source. You can enable it with the following:
- Add environment variable to your lambda function:
NODE_OPTIONS: "--enable-source-maps"
- Add sourceMap: true in tsconfig.json file.
AWS CDK adjustments
When you run any Merloc command, you will probably get the error “Unable to detect default invoker. Consider specifying invoker by options”, since Merloc is meant only for Serverless Framework and AWS SAM.
How it works
Invoker is chosen based on presented template:
- template.yml (SAM) — sam-local
- serverless.yml (Serverless Framework) — serverless-local
If your project is built with AWS CDK, you do not have any of them. Workaround can be:
- Create a template from cdk output manually
- Configure merloc commands
An additional step can be to install AWS SAM CLI if you don’t have it installed.
Create a template from cdk output manually
- CDK Synth will synthesize a stack defined in your app into a CloudFormation template in a json file in the cdk.out folder.
- You can run cdk synth and store the result in template.yml file
- CDK Synth > template.yml
Since template.yml is presented, you can run merloc command to test your lambda function locally. Sam local will be recognized as an invoker.
The disadvantage of this approach is that reload cannot work automatically since it runs sam build and template.yml has the old version. You can have new changes on your local, but you should build the project and generate template.yml again.
Configure merloc commands
–sam-init <cmd> — command to be run initially once, the default value is sam build
Instead of sam build, do the following:
- Compile your local changes (npm run build).
- Synthesize your stack (cdk synth).
- Run sam build with the template path specified since the default path is the project root directory and cdk generate output in cdk.out folder.
--sam-init 'npm run build && cdk synth && sam build -t cdk.out/${stackName}.template.json'
–sam-reload <cmd> — command to be run on hot-reload when changes are detected, default value is sam build.
Usually, the same command will be used:
--sam-reload 'npm run build && cdk synth && sam build -t cdk.out/${stackName}.template.json'
-w <paths…> — configure paths to files to be watched for changes in order to trigger hot-reload automatically.
If you find a declaration file (.d.ts) after compilation, it means that declaration is enabled as a compiler option in tsconfig.json. Every build generates .d.ts file, and every change triggers reload. It would lead to infinite reload, so those files should be excluded. That means all .ts files should be watched for changes except .d.ts files.
-w '**/**/*.ts' '!**/**/*.d.ts'
So, the whole command should look like:
merloc -b ${brokerUrl} -i sam-local --sam-init 'npm run build && cdk synth && sam build -t cdk.out/${stackName}.json' --sam-reload 'npm run build && cdk synth && sam build -t cdk.out/${stackName}.template.json' -d -r -w '**/**/*.ts' '!**/**/*.d.ts'
It doesn’t look nice, but it works! 😊
Pros
- Mostly used programming languages supported (not only Node.js).
- Hot-reload — no need to re-deploy your stack after every change.
- Debugging — easily debug lambda from your IDE.
- Easily invoke function from real AWS Lambda environment.
Cons
- Thundra is no longer in service (no Merloc updates from December 2022).
- Additional hacks are needed if you want to make AWS CDK work.
Technique #4 — Debugging Lambda deployed using SST
SST is a framework for building full-stack serverless applications on AWS. Among other things, it is used for writing Infrastructure as Code (IaC). It is built on top of AWS CDK so the main idea is to use so-called constructs. It abstracts some complexities when working with AWS CloudFormation or AWS CDK and provides additional features that CDK doesn’t support.
While it’s possible to mix CDK and SST constructs in one app and SST allows configuring properties of underlying CDK constructs (if using SST ones), for using additional features, only SST constructs can be used.
One of those features is called Live Lambda, which enables debugging and testing Lambda functions locally while being invoked remotely by resources in AWS. It can also detect changes and quickly reload a function.
Below are code examples for creating Function constructs with SST and CDK, which look almost identical.
					import { Function } from 'sst/constructs';

new Function(stack, 'MyFunction', {
    handler: 'handler',
    runtime: "nodejs18.x",
});


import { Function, Runtime } from 'aws-cdk-lib/aws-lambda';

new Function(stack, 'MyFunction', {
    handler: 'handler'
    runtime: Runtime.NODEJS_18_X,
})
Pros
- Completely serverless, cheap, and fast.
- Supports all Lambda triggers.
- Supports multiple languages.
Cons
- Cannot access resources in VPC (please see the section below).
- Cannot work with CDK Function construct, which means you must build your functions using SST one.
Technique #5 — Debugging Lambda deployed using Samp-cli
Samp-cli addresses the shortcomings of local emulators by enabling developers to run Lambda functions on their local machines under the same context and IAM permissions as in the cloud. This tool supports various runtimes, including JavaScript/TypeScript, .NET, and Python, with plans to include Java, Go, and Ruby.
The inspiration for Samp-cli came from a demonstration of sst.dev by Sebastian Bille, showcasing local debugging capabilities. The primary goals of Samp-cli include avoiding additional dependencies, maintaining compatibility with existing SAM templates and CDK code, and supporting debugging for all Lambda runtimes.
The debugging process with Samp-cli involves:
- Installing the tool
- Deploying the CDK stack to AWS
- Configuring the launch settings
- Initiating the debugging session
During debugging, Samp-cli temporarily replaces the function code in AWS with a relay proxy, establishing an MQTT connection to AWS IoT Core for communication.
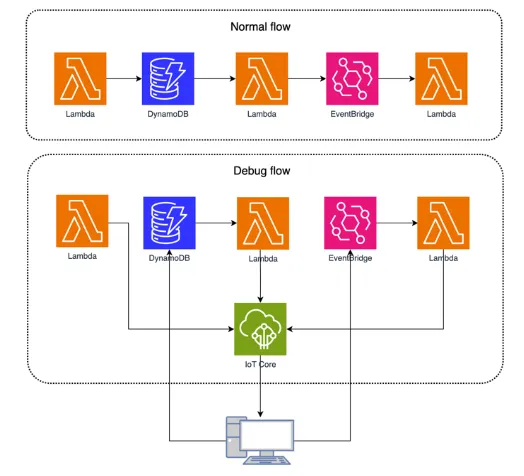
Understanding the flow during debugging is crucial, as Samp-cli modifies function configurations, sets memory size and timeout values, and utilizes an MQTT connection for local and cloud communication. After debugging, a cleanup script ensures that functions are restored to their original state.
Despite its advantages, Samp-cli has limitations, including potential issues with CDK setups, VPC, and Lambda Layers.
Installation and running
The installation and use of samp-cli for local Lambda debugging involve several steps:
1. Install samp-cli.
Install the latest version of samp-cli using the command:
npm install -g samp-cli
This step ensures you have the necessary tools for debugging.
2. Deploy CDK Stack.
If you haven’t already, deploy your CDK stack to AWS with:
cdk deploy
This step is crucial for setting up the environment where samp-cli will operate.
3. Configure Launch Configuration.
For VSCode users, configure the launch configuration by running the following command from your project root:
samp local --debug
This setup is required to initiate the local debugging process.
4. Start Debugging.
Before starting, it’s essential to understand that samp-cli replaces your function code in AWS with a relay proxy during the debug session. The local machine and relay proxy establish an MQTT connection to AWS IoT Core for communication. The function’s MemorySize is set to 128MB and Timeout to 60 seconds (modifiable via launch.json) to facilitate debugging.
5. Stop Debugging.
Once debugging is complete, a clean-up script restores each function according to the last deploy in CloudFormation. In case of failures, like expired AWS credentials, you can use samp local –force-restore or redeploy your stack.
6. Limitations and Considerations.
Be aware of certain limitations:
- CDK setups vary, and some may not work with samp-cli.
- Functions using Lambda Layers may encounter issues; ensure necessary layers are in your devDependencies.
- Functions accessing resources in a VPC need a tunnel to VPC resources or can mock calls using the LOCAL_DEBUG environment variable.
Found issues (and how to overcome them)
Here is a list of issues that we found out during testing. For some of them, we made a workaround to be still able to use it. All issues are related to version 1.0.59.
1. It doesn’t work on the Windows-based systems
We encountered errors when attempting to execute it on a Windows-based system. After investigation, we found out that the developer who wrote the code was hardcoding path separators. Below is the workaround for how to make it work, but we hope that the developer who works on samp-cli will fix it in future versions. Here is a link to the opened issue on the GitHub repository: Issue. Changes are related to cdk-wrapper.js file. Below the line:
let entry = fingerprintOptions?.bundling?.relativeEntryPath || (fingerprintOptions?.path ? `${fingerprintOptions?.path}/` : null);
Add the following code:
entry = entry.replaceAll(‘\\’, ‘/’);
2. It doesn’t work with parametrized stacks
While testing different cases, we found out that it doesn’t work with parametrized stacks. The issue about that was already opened by another developer who noticed the same. We made a workaround to make it work, but there is a precondition to export stack with the name “stack”, as in the example below:
export const stack = new CdkSampStack(app, "CdkSampStack", { table });
To make it work, final step is to replace cdk-wrapper.js file with changed cdk-wrapper.js
3. .samp-out folder containing only JS/TS files
When run, Samp-cli first compiles the app and CDK code with .samp-out as an output directory. This folder is used to execute a deploy and it contains only files with .js and .ts extension, so you might end up copying some files manually into this folder afterward. For example, if you reference an open-api.yaml file in your CDK code when creating API Gateway specification, Samp will not recognize this, so you need to make sure all required files are in the output directory by yourself.
4. CDK deployment with additional parameters
In one of the examples that we tested, we had CDK deployment with additional parameters. For example:
cdk deploy -c env=dev
Unfortunately, samp-cli didn’t recognize parameters, so our CDK code didn’t receive them, and deployment failed. We avoided this in a dirty way by hardcoding some values in CDK.
Pros
- When it works, it works great.
- Works on real AWS environment (no mocks).
- Fast and cheap.
Cons
- Developed and maintained by one developer.
- Generating launch configuration is only available for VSCode .
- Variety of issues during different cases.
- Java and Go are not supported (NodeJS, Python, and .NET are supported).
AWS resources in a VPC
Resources like RDS or Redis instances, which are deployed in a VPC, are by default not accessible outside of the VPC. If your app connects to these resources and you need them for debugging, you can use the following options:
- Connect to a VPC using a VPN connection.
- Connect to a local resource instead (database, Redis, etc.).
Conclusion
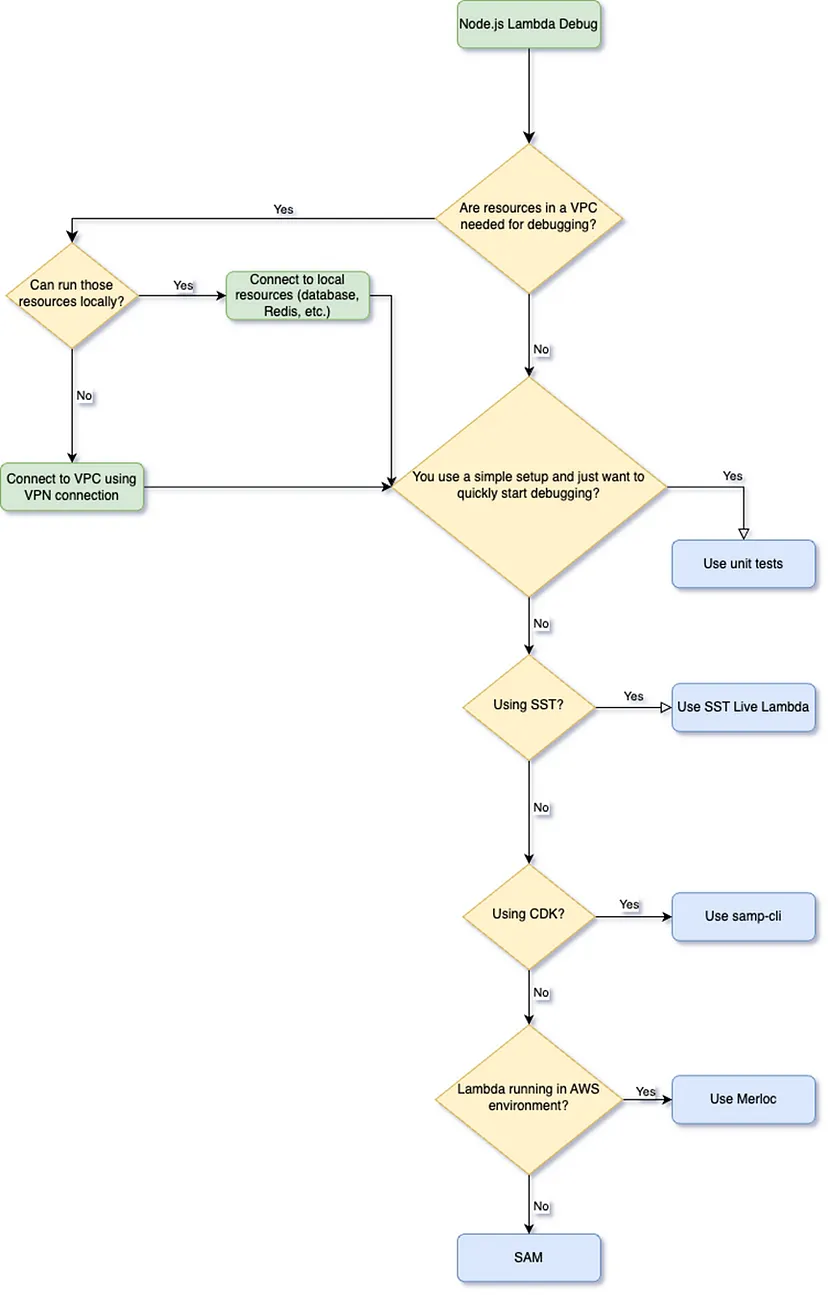
In this blog post, we have presented different tools and techniques we have used to debug AWS Lambdas. As you can tell, there is no ultimate or one-size-fits-all solution. Depending on your tech stack and setup, you can use the algorithm below to make it easier to find the best approach for your use case.
If there are some other ways or tools to debug AWS Lambdas, please contact us.
In this article:
Filip Stanišić,
Miroslav Galić,
Marko Jevtović,
Levi9 Serbia